 PSG and Manchester City will collide tonight in the first leg of their Quarter Final tie in the UEFA Champions League.
The Sky Blues are making their first appearance in the last eight of the competition. Can they beat the high flying French champions?
Fantasy Football site Oulala have come up with a combined XI after a stat comparison between the players of the two teams.
GK: Kevin Trapp beats Joe Hart
Clean Sheets – 16 to 13
Saves (per game) – 2.5 to 2.1
Saves (per goal) – 4.3 to 2.2
Goals Conceded (per game) – 0.6 to 1
Catches (per game) – 2.2 to 2.7
Punches (per game) – 0.1 to 1
LB: Gaël Clichy beats Maxwell
Chances Created (per game) – 1 to 0.9
Clearances (per game) – 3.1 to 2
Successful Passes (per game) – 43 to 51
Interceptions (per game) – 4 to 1.9
Tackles Won (per game) – 1.8 to 0.7
Successful Take-Ons (per game) – 1.2 to 0.3
CB: Nicolás Otamendi beats Thiago Silva
Tackles Won (per game) – 2 to 1.3
Tackle Success Rate – 38% to 53%
Clearances (per game) – 7.6 to 4.7
Interceptions (per game) – 3.4 to 3
Blocks (per game) – 0.4 to 0.5
Aerial Duels Won (per game) – 3 to 2
CB: David Luiz beats Eliaquim Mangala
Tackles Won (per game) – 1.2 to 1.1
Tackle Success Rate – 52% to 41%
Clearances (per game) – 3.1 to 5.2
Interceptions (per game) – 3 to 2.7
Blocks (per game) – 0.4 to 0.3
Aerial Duels Won (per game) – 1.2 to 1.8
RB: Pablo Zabaleta beats Marquinhos
Chances Created (per game) – 0.1 to 0
Clearances (per game) – 2.6 to 3.2
Successful Passes (per game) – 37 to 51
Interceptions (per game) – 2 to 1.1
Tackles Won (per game) – 2.3 to 1
Successful Take-ons (per game) – 0.4 to 0.1
CM: Fernando beats Adrien Rabiot
Chances Created (per game) – 0.4 to 0.3
Key Passes (per game) – 0.4 to 0.3
Clearances (per game) – 1.6 to 0.7
Interceptions (per game) – 1.6 to 1.9
Tackles Won (per game) – 1.8 to 2.4
Pass Completion Rate – 90% to 90%
CM: Fernandinho beats Thiago Motta
Chances Created (per game) – 0.9 to 0.6
Key Passes (per game) – 0.8 to 0.5
Clearances (per game) – 1.6 to 0.9
Interceptions (per game) – 1.6 to 1.3
Tackles Won (per game) – 2.4 to 1.5
Pass Completion Rate – 88% to 92%
LW: Kevin De Bruyne beats Lucas Moura
Chances Created (per game) – 3.5 to 1.4
Key Passes (per game) – 3 to 1.2
Pass Completion Rate – 78% to 86%
Successful Take-Ons (per game) – 1.3 to 2.4
Assists – 9 to 4
Goals – 6 to 6
AM: David Silva beats Blaise Matuidi
Chances Created (per game) – 2.9 to 0.9
Key Passes (per game) – 2.4 to 0.7
Pass Completion Rate – 86% to 92%
Successful Take-ons (per game) – 1.4 to 0.7
Assists – 11 to 5
Goals – 2 to 3
RW: Ángel Di María beats Jesús Navas
Chances Created (per game) – 3 to 1.6
Key Passes (per game) – 2.4 to 1.4
Pass Completion Rate – 80% to 84%
Successful Take-Ons (per game) – 1.7 to 1.4
Assists – 12 to 5
Goals – 9 to 0
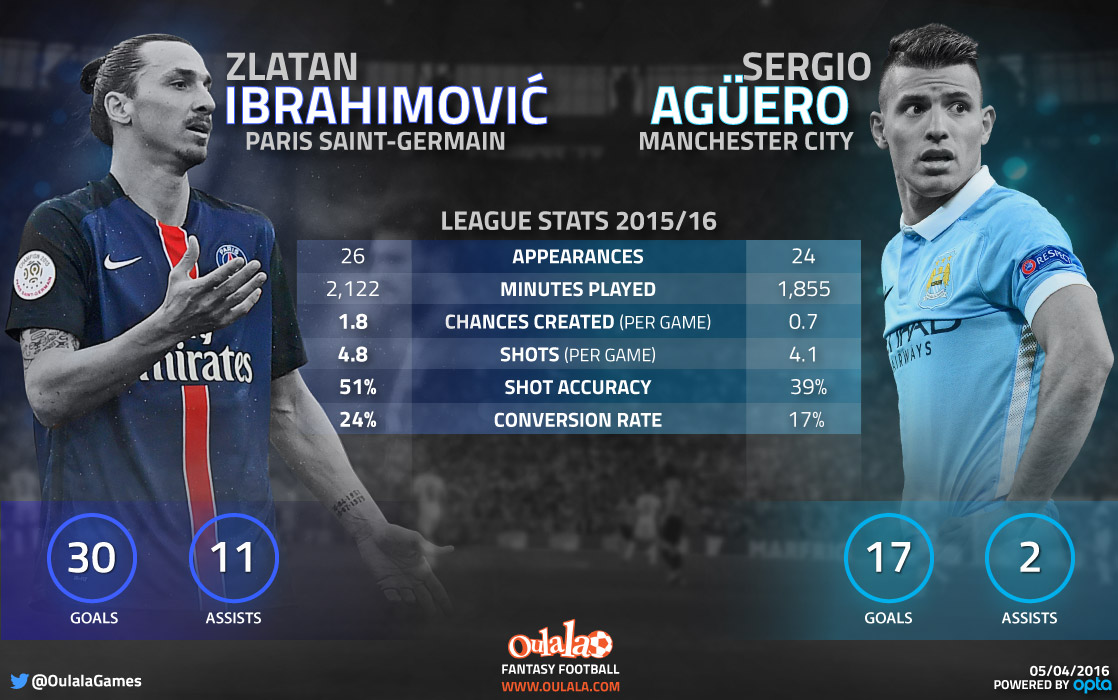
CF: Zlatan Ibrahimovic beats Sergio Agüero
Chances Created (per game) – 1.8 to 0.7
Assists – 11 to 2
Shots (per game) – 4.8 to 4.1
Shot Accuracy – 51% to 39%
Conversion Rate – 24% to 17%
Goals – 30 to 17
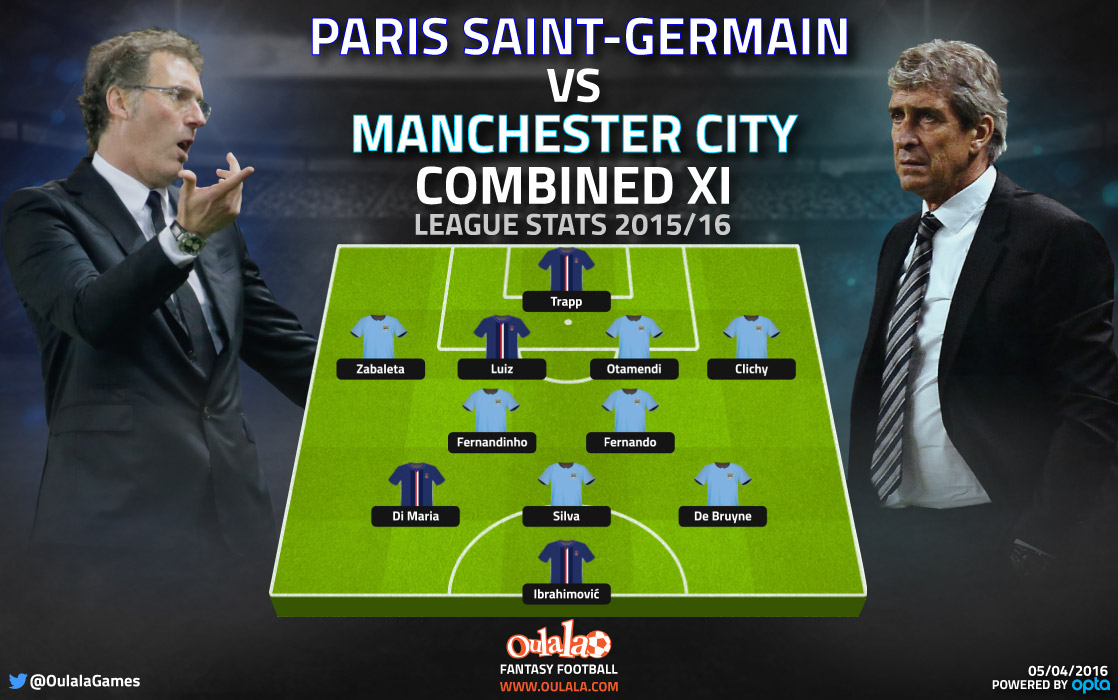
No Place for Aguero: PSG vs Man City Combined XI – Infographic
(Visited 128 times, 1 visits today)